
How to Interpret a Peptide Chromatogram: A Practical Guide
How to interpret a peptide chromatogram is an important skill when reviewing laboratory analytical data for synthetic peptides. A chromatogram can show how a sample separates during high-performance liquid chromatography (HPLC), where signals appear, and whether the analysis reports a dominant component alongside smaller detected peaks. However, reading the graph correctly requires more than looking for one tall peak or a high purity percentage.
For researchers reviewing analytical documentation, understanding the axes, peak shape, retention time, integration and testing method helps put reported results into context. This guide explains how to interpret a peptide chromatogram step by step, what common patterns may indicate, and which conclusions cannot be drawn from the graph alone.
Knowing how to interpret a peptide chromatogram helps researchers distinguish what the analytical trace demonstrates from what still requires separate testing.
What Is a Peptide Chromatogram?
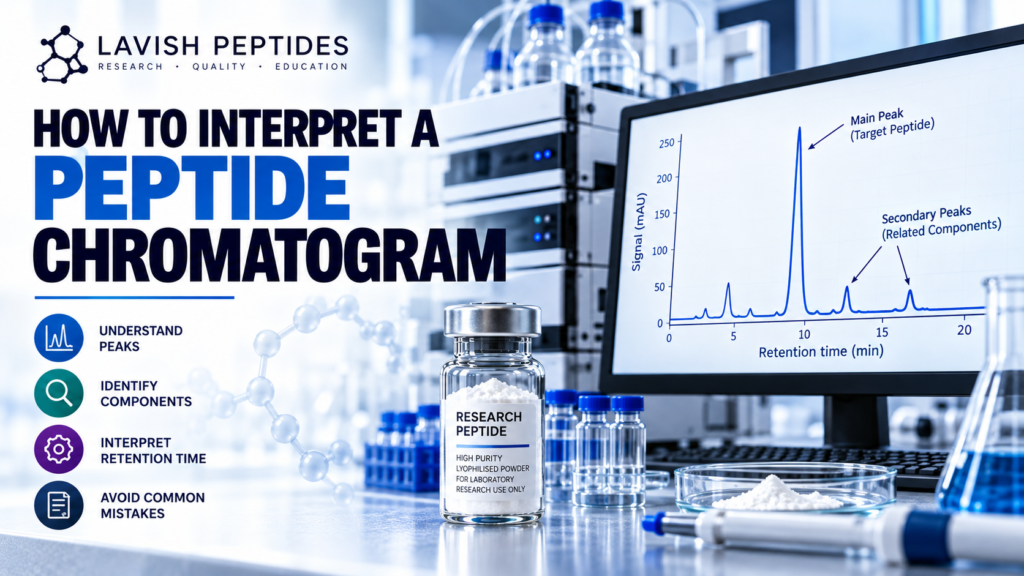
A peptide chromatogram is a graphical record of a chromatographic separation. In HPLC, a sample travels through a column under controlled conditions. Different components interact with the column and mobile phase differently, so they may leave the column at different times.
A detector records the response as the separation progresses. The resulting trace is displayed as a series of peaks against a baseline. Each detected peak represents a signal produced by material reaching the detector under the selected analytical conditions.
When learning how to interpret a peptide chromatogram, remember that the graph represents a particular test performed using a defined method. It is not a complete picture of every chemical component in a sample, and a peak does not automatically identify a specific substance.
1. Read the Axes Before Examining the Peaks
Before assessing the main peak or smaller signals, check what each axis represents.
X-axis: Retention Time
The horizontal axis usually shows retention time, commonly measured in minutes. It indicates when a detected component reaches the detector after the sample enters the chromatographic system.
For example, a peak at 10 minutes means the detector recorded that signal at approximately that point in the run. It does not mean the component is 10 minutes old, nor does the time alone identify the peptide.
Retention time depends on the column, mobile-phase composition, gradient, flow rate, temperature and other method conditions. A result should therefore be compared with appropriate reference information obtained under comparable conditions.
Y-axis: Detector Response
The vertical axis displays the detector signal. Depending on the instrument and method, it may be shown as absorbance, such as milli-absorbance units (mAU), or another response unit.
A taller peak produces a larger signal at its maximum, but peak height and peak area are not the same measurement. Peak height is the maximum signal above the baseline; peak area reflects the integrated signal across the peak’s width.
For many purity calculations, integrated peak area is more relevant than height. Always check the report’s units and the calculation used.
This first step in how to interpret a peptide chromatogram prevents retention time and detector response from being mistaken for direct measurements of peptide identity or content.
2. Identify the Main Peak
The main peak is generally the prominent signal assigned to the target component in the analytical report. In a typical peptide purity chromatogram, it may be much larger than the surrounding peaks.
However, size alone does not prove identity. The assignment should be supported by the analytical method and, where appropriate, comparison with a reference standard or an independent identity test such as mass spectrometry.
When reviewing the main peak, ask:
- Is the peak labelled or assigned to the intended peptide?
- Does the reported retention time agree with the method or reference information?
- Is the peak separated clearly from nearby signals?
- Is the baseline visible around the peak?
- Does the report explain how the peak was integrated?
These questions make how to interpret a peptide chromatogram a structured review rather than a visual guess.
3. Understand Secondary Peaks
Smaller peaks may appear before or after the main peak. Depending on the method and sample, these signals can be associated with peptide-related impurities, degradation products, residual synthesis-related components or other detectable substances.
But a chromatogram does not identify an unknown peak by position alone. A small peak at a particular retention time cannot reliably be labelled as oxidation, a truncated sequence or another impurity without supporting analytical evidence.
What Do Small Peaks Mean?
A secondary peak indicates that the detector recorded another signal under the conditions used. Its significance depends on factors such as:
- The peak’s integrated area relative to the total included area.
- Whether the method can separate relevant components.
- The detector’s sensitivity and response to those components.
- Whether the peak has been identified or remains unknown.
- The analytical specification and acceptance criteria for the test.
A chromatogram with several small peaks is not automatically unacceptable, just as a chromatogram with one dominant peak is not proof of complete purity. Interpretation depends on the method, its purpose and the material being assessed.
A reliable approach to how to interpret a peptide chromatogram considers the method, peak integration and supporting evidence before assigning a meaning to any secondary signal.
4. Understand HPLC Purity and Peak Area
A commonly reported HPLC purity result uses area normalisation. In a simplified calculation, the integrated area assigned to the target peak is divided by the total integrated area of the peaks included in the calculation, then multiplied by 100.
Illustrative formula:
Area percentage = (target peak area ÷ total included peak area) × 100
For example, suppose the target peak has an integrated area of 9,600 units and the total area included in the calculation is 10,000 units. The target peak represents 96% of that included detector response.
This is an illustrative calculation, not a laboratory result or a claim about any product.
The key limitation is that area percentage describes the signals included in the method’s calculation. It does not necessarily equal the percentage of the entire sample by mass. Different substances can produce different detector responses, and some substances may not be detected or included in the calculation.
That is why how to interpret a peptide chromatogram involves reviewing both the reported percentage and the method behind it. A number such as 98% should not be treated as a universal measure of every aspect of sample quality.
When deciding how to interpret a peptide chromatogram, always establish whether the reported purity is based on area normalisation or another calculation.
5. Examine Peak Shape and Baseline
Peak shape provides useful clues about the quality of the separation, but it must be interpreted cautiously.
Symmetrical Peaks
A relatively symmetrical, well-resolved peak can indicate a cleaner separation under the method conditions. It does not independently establish chemical identity or prove that no other components are present.
Tailing or Fronting
A peak may show tailing, fronting or other asymmetry. Possible causes include sample overload, interactions with the column, unsuitable method conditions, column condition or sample-related effects. The shape alone usually cannot identify the cause.
Shoulders and Overlapping Peaks
A shoulder on the side of a peak can indicate partial separation or overlapping signals. Two components may be insufficiently resolved to appear as distinct peaks.
This matters because co-eluting components can contribute to one apparent peak. A graph that looks simple may therefore provide less separation than expected. Method suitability and additional testing may be needed to investigate unresolved components.
Baseline Disturbances
A drifting or noisy baseline can affect integration and make small signals harder to assess. Check whether the report shows baseline correction, peak integration boundaries and any notes about excluded or unresolved signals.
These observations are essential when learning how to interpret a peptide chromatogram because poor resolution can hide differences between components.
6. Check the Method and Detection Wavelength
A chromatogram cannot be interpreted properly without understanding how it was produced. Review the analytical method, including the column, mobile phase, gradient, flow rate, temperature where relevant, detector and detection wavelength.
Many peptide HPLC methods use ultraviolet detection, often at a wavelength selected for the analytical purpose. Different detection conditions can change the signal obtained from different components. A component that responds weakly under one method may be more difficult to detect than a component with a stronger response.
Also look for information about sample preparation, reference standards, integration settings and method suitability. If a report omits important details, recognise the limitation rather than assuming the missing information.
The European Medicines Agency’s guidance on the development and manufacture of synthetic peptides discusses peptide characterisation, analytical control and the need for suitable methods to assess identity and impurities.
7. Compare the Chromatogram With the Certificate of Analysis
A certificate of analysis (COA) may summarise the result of a chromatographic test, but the chromatogram and the COA should be reviewed together.
Check the following details:
- Sample identity: The material name should match the associated documentation.
- Batch or lot number: Confirm that the report corresponds to the batch being documented.
- Test method: Identify the method used to generate the chromatogram.
- Reported purity: Check how the percentage was calculated and which peaks were included.
- Acceptance criteria: Determine whether the result is compared with a stated specification.
- Test date and laboratory: Review the source and date of the analysis.
- Identity evidence: Check whether a separate method supports the assignment of the target peptide.
If you need more background, read our related guides on what HPLC purity means and peptide purity versus peptide content. These topics are related, but they answer different questions: chromatographic purity describes the result of a specific analytical method, while peptide content concerns how much peptide material is present in a sample.
Use those internal URLs only if they match the published slugs on your website; otherwise, replace them with the live article URLs.
Knowing how to interpret a peptide chromatogram alongside its COA makes it easier to identify missing information, unclear calculations and results that need clarification.
8. What a Peptide Chromatogram Cannot Prove
A chromatogram is useful analytical evidence, but its conclusions have boundaries. Even when the main peak is prominent and the reported area percentage is high, the graph alone does not establish every quality attribute.
On its own, a chromatogram may not prove:
- The complete molecular identity or amino-acid sequence.
- The exact mass of the target peptide.
- The total amount of peptide in the vial.
- The absence of water, salts, counter-ions or other components not measured by the method.
- The absence of impurities that co-elute with the main peak.
- Sterility, endotoxin status or suitability for human use.
- Long-term stability or an appropriate storage history.
Other methods may be required depending on the material, purpose and applicable specification. For example, mass spectrometry can provide evidence about molecular mass, while other appropriately selected methods may be needed to assess content or particular impurities.
The EMA’s synthetic peptide guideline explains that identity, assay and impurity control may require suitable analytical procedures rather than reliance on a single measurement. See the official EMA synthetic peptide guideline.
9. A Practical Checklist for Reviewing a Chromatogram
When reviewing a peptide chromatogram, use this checklist:
- Confirm the sample and batch identifiers.
- Read both axes and note the units.
- Check the method and detection wavelength.
- Identify the peak assigned to the target peptide.
- Review retention time against suitable reference information.
- Examine peak area, shape, baseline and resolution.
- Check how purity was calculated and which peaks were included.
- Look for shoulders, overlapping peaks and unexplained signals.
- Compare the chromatogram with the COA and stated specification.
- Check whether identity and other relevant quality attributes were assessed independently.
This approach helps researchers avoid treating a single graph or percentage as a complete quality assessment.
In practice, how to interpret a peptide chromatogram comes down to reviewing the full trace, understanding the analytical method and checking that conclusions are supported by appropriate evidence.
Frequently Asked Questions
What Is the Main Peak on a Peptide Chromatogram?
The main peak is the prominent signal assigned to the target component under the analytical method. Its identity should be supported by the report and suitable analytical evidence; peak size alone is not proof.
Do More Peaks Mean a Peptide Is Impure?
Not necessarily. Secondary peaks show additional detected signals, but their identity and significance depend on the method, sample and applicable criteria. Some peaks may represent impurities, while others require further investigation before they can be assigned.
Does a High HPLC Purity Percentage Prove the Peptide Is 99% Pure by Weight?
No. Area-normalised HPLC purity is based on included detector signals. It does not automatically establish mass percentage, total peptide content or the absence of components that the method does not detect adequately.
Can Retention Time Identify a Peptide?
Retention time can support identification when compared with suitable reference information under comparable conditions. It is not normally sufficient by itself to establish molecular identity.
Why Might Two Laboratories Report Different Chromatograms?
Differences can arise from columns, mobile phases, gradients, flow rates, detectors, integration settings, sample preparation and other method conditions. Results should be compared only after considering whether the methods are suitably comparable.
Is a Chromatogram Enough to Verify a Peptide COA?
No. A chromatogram is one piece of analytical evidence. Review the sample and batch details, method, reported results, acceptance criteria and other relevant identity or quality tests before drawing conclusions.
Conclusion: How to Interpret a Peptide Chromatogram Correctly
Learning how to interpret a peptide chromatogram means examining the whole analytical record—not just the tallest peak or the headline purity percentage. Start with the axes, retention time and method; then assess peak area, peak shape, secondary signals, integration and the relationship between the chromatogram and the COA.
Most importantly, recognise the limits of the data. A chromatogram can support an assessment of separation and reported purity, but it does not independently prove molecular identity, total peptide content or every aspect of sample quality. A careful interpretation combines the chromatogram with appropriate methods, traceable batch documentation and clearly stated acceptance criteria.
For more educational material, visit the Lavish Peptides blog and review the relevant analytical documentation for the material under study.
This article is for laboratory education only. It is not medical advice, and it does not establish that any product is authorised for human use.
Understanding how to interpret a peptide chromatogram requires careful attention to peak identification, retention time, detector response and the analytical method. Researchers should compare the main peak with appropriate reference data, review secondary peaks and confirm how HPLC purity was calculated. When learning how to interpret a peptide chromatogram, it is also important to check the certificate of analysis (COA), batch details and supporting identity tests before drawing conclusions about sample quality.
